【AWS】【CentOS7】CloudWatch エージェントでログ監視をする設定手順

公開日時:2019年09月16日 / 最終更新日時:2019年09月17日

Amazon CloudWatch エージェントをインストールし、CentOS7 でログ監視をする設定手順について解説します。

/var/log/messages などのログファイルを監視して特定のエラーなどが出力されたらアラートメールを送信するということは Zabbix で既に設定されている企業も多いかと思いますが、今後クラウド環境、特に AWS 環境に移行する場合は CloudWatch エージェントを利用する方向になると思います。


Amazon Linux 2 の場合は以下の記事を参考にしてください。


【AWS】【AmazonLinux2】CloudWatch エージェントでログ監視をする設定手順【awslogsd】


手順概要

今回の設定手順は以下のようになりました。

  1. CloudWatch エージェントをインストール
  2. CloudWatch エージェントの設定
  3. CloudWatch の設定
  4. 動作確認


環境

OS は CentOS 7 です。

■OS

[root@CentOS7 ~]# cat /etc/redhat-release
CentOS Linux release 7.6.1810 (Core)
[root@CentOS7 ~]#


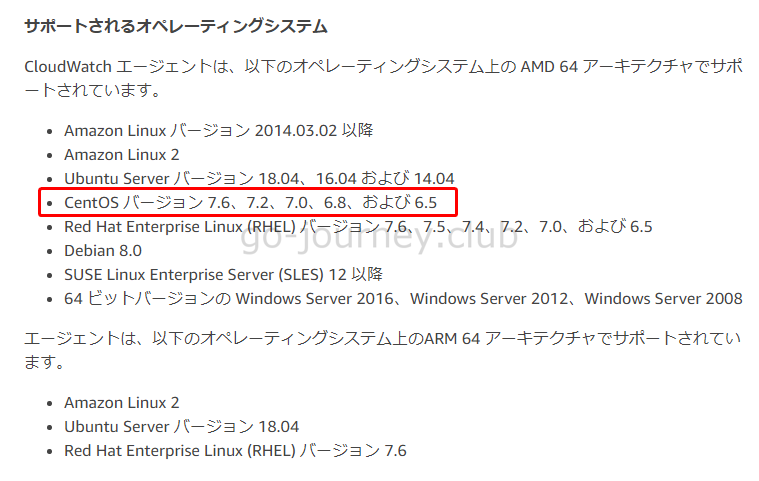
CloudWatch エージェントがサポートされている OS やバージョン情報があるので事前に確認しておきます。


【AWS】CloudWatch エージェントのサポートOSとバージョン情報(2019年9月16日更新)
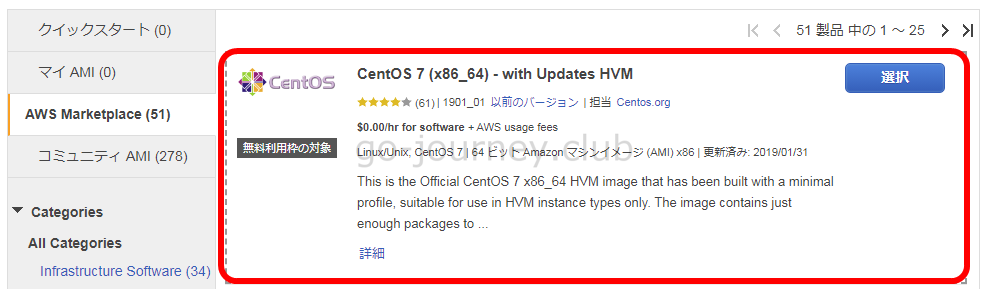


【AWS】【CentOS7】CloudWatch エージェントでログ監視をする設定手順


AWS AMI はCentOS 7 (x86_64) - with Updates HVMを利用しました。


CloudWatch エージェントをインストール

以下の記事は RedHat に CloudWatch エージェントをインストールする手順です。


【AWS】CloudWatch エージェントをインストールして EC2 インスタンス(RedHat Linux)のメモリ使用率を取得する設定手順


root にスイッチします。

[centos@CentOS7 ~]$ sudo su -
Last login: Mon Sep 16 06:17:49 UTC 2019 on pts/1
[root@CentOS7 ~]#


wgetコマンドをインストールします。

[root@CentOS7 ~]# yum install wget


■CentOSのダウンロードリンク

https://s3.amazonaws.com/amazoncloudwatch-agent/centos/amd64/latest/amazon-cloudwatch-agent.rpm


■参考

コマンドラインを使用して CloudWatch エージェントをダウンロードおよび設定する

https://docs.aws.amazon.com/ja_jp/AmazonCloudWatch/latest/monitoring/download-cloudwatch-agent-commandline.html


以下のコマンドで CentOS 用の CloudWatch エージェントのインストールパッケージをダウンロードします。

[root@CentOS7 ~]# wget https://s3.amazonaws.com/amazoncloudwatch-agent/centos/amd64/latest/amazon-cloudwatch-agent.rpm 


[root@CentOS7 ~]# ls -lh 
total 57M 
-rw-r--r--. 1 root root  57M Sep  9 17:38 amazon-cloudwatch-agent.rpm 
-rw-------. 1 root root 6.8K Jan 28  2019 anaconda-ks.cfg 
-rw-------. 1 root root 6.5K Jan 28  2019 original-ks.cfg 
[root@CentOS7 ~]#


以下のコマンドで CloudWatch エージェントをインストールします。

[root@CentOS7 ~]# yum install amazon-cloudwatch-agent.rpm


「/opt/aws/amazon-cloudwatch-agent/bin/」ディレクトリに移動して「amazon-cloudwatch-agent-config-wizard」ファイルを確認します。

[root@CentOS7 ~]# cd /opt/aws/amazon-cloudwatch-agent/bin/ 
[root@CentOS7 bin]# ls -lh 
total 149M 
-rwxr-xr-x. 1 root root  71M Aug 23 05:49 amazon-cloudwatch-agent 
-rwxr-xr-x. 1 root root  14M Aug 23 05:49 amazon-cloudwatch-agent-config-wizard 
-rwxr-xr-x. 1 root root 9.7K Aug 23 05:49 amazon-cloudwatch-agent-ctl 
-rwxr-xr-x. 1 root root  12M Aug 23 05:49 config-downloader 
-rwxr-xr-x. 1 root root  27M Aug 23 05:49 config-translator 
-rw-r--r--. 1 root root   11 Aug 23 05:49 CWAGENT_VERSION 
-rwxr-xr-x. 1 root root  27M Aug 23 05:49 start-amazon-cloudwatch-agent 
[root@CentOS7 bin]#


「amazon-cloudwatch-agent-config-wizard」コマンドを実行します。

[root@CentOS7 bin]# ./amazon-cloudwatch-agent-config-wizard 
============================================================= 
= Welcome to the AWS CloudWatch Agent Configuration Manager = 
============================================================= 
On which OS are you planning to use the agent? 
1. linux 
2. windows 
default choice: [1]: 

Trying to fetch the default region based on ec2 metadata... 
Are you using EC2 or On-Premises hosts? 
1. EC2 
2. On-Premises 
default choice: [1]: 

Which user are you planning to run the agent? 
1. root 
2. cwagent 
3. others 
default choice: [1]: 

Do you want to turn on StatsD daemon? 
1. yes 
2. no 
default choice: [1]: 

Which port do you want StatsD daemon to listen to? 
default choice: [8125] 
 
What is the collect interval for StatsD daemon? 
1. 10s 
2. 30s 
3. 60s 
default choice: [1]: 

What is the aggregation interval for metrics collected by StatsD daemon? 
1. Do not aggregate 
2. 10s 
3. 30s 
4. 60s 
default choice: [4]: 

Do you want to monitor metrics from CollectD? 
1. yes 
2. no 
default choice: [1]: 

Do you want to monitor any host metrics? e.g. CPU, memory, etc. 
1. yes 
2. no 
default choice: [1]: 

Do you want to monitor cpu metrics per core? Additional CloudWatch charges may apply. 
1. yes 
2. no 
default choice: [1]: 

Do you want to add ec2 dimensions (ImageId, InstanceId, InstanceType, AutoScalingGroupName) into all of your metrics if the info is available? 
1. yes 
2. no 
default choice: [1]: 

Would you like to collect your metrics at high resolution (sub-minute resolution)? This enables sub-minute resolution for all metrics, but you can customize for specific metrics in the output json file. 
1. 1s 
2. 10s 
3. 30s 
4. 60s 
default choice: [4]: 

Which default metrics config do you want? 
1. Basic 
2. Standard 
3. Advanced 
4. None 
default choice: [1]: 

Current config as follows: 

        "agent": { 
                "metrics_collection_interval": 60, 
                "run_as_user": "root" 
        }, 
        "metrics": { 
                "append_dimensions": { 
                        "AutoScalingGroupName": "${aws:AutoScalingGroupName}", 
                        "ImageId": "${aws:ImageId}", 
                        "InstanceId": "${aws:InstanceId}", 
                        "InstanceType": "${aws:InstanceType}" 
                }, 
                "metrics_collected": { 
                        "collectd": { 
                                "metrics_aggregation_interval": 60 
                        }, 
                        "cpu": { 
                                "measurement": [ 
                                        "cpu_usage_idle", 
                                        "cpu_usage_iowait", 
                                        "cpu_usage_user", 
                                        "cpu_usage_system" 
                                ], 
                                "metrics_collection_interval": 60, 
                                "resources": [ 
                                        "*" 
                                ], 
                                "totalcpu": false 
                        }, 
                        "disk": { 
                                "measurement": [ 
                                        "used_percent", 
                                        "inodes_free" 
                                ], 
                                "metrics_collection_interval": 60, 
                                "resources": [ 
                                        "*" 
                                ] 
                        }, 
                        "diskio": { 
                                "measurement": [ 
                                        "io_time", 
                                        "write_bytes", 
                                        "read_bytes", 
                                        "writes", 
                                        "reads" 
                                ], 
                                "metrics_collection_interval": 60, 
                                "resources": [ 
                                        "*" 
                                ] 
                        }, 
                        "mem": { 
                                "measurement": [ 
                                        "mem_used_percent" 
                                ], 
                                "metrics_collection_interval": 60 
                        }, 
                        "netstat": { 
                                "measurement": [ 
                                        "tcp_established", 
                                        "tcp_time_wait" 
                                ], 
                                "metrics_collection_interval": 60 
                        }, 
                        "statsd": { 
                                "metrics_aggregation_interval": 60, 
                                "metrics_collection_interval": 60, 
                                "service_address": ":8125" 
                        }, 
                        "swap": { 
                                "measurement": [ 
                                        "swap_used_percent" 
                                ], 
                                "metrics_collection_interval": 60 
                        } 
                } 
        } 

Are you satisfied with the above config? Note: it can be manually customized after the wizard completes to add additional items. 
1. yes 
2. no 
default choice: [1]: 

Do you have any existing CloudWatch Log Agent (http://docs.aws.amazon.com/AmazonCloudWatch/latest/logs/AgentReference.html) configuration file to import for migration? 
1. yes 
2. no 
default choice: [2]: 

Do you want to monitor any log files? 
1. yes 
2. no 
default choice: [1]: 

Log file path: 
/var/log/messages 
Log group name: 
default choice: [messages] 
 
Log stream name: 
default choice: [{instance_id}] 
 
Do you want to specify any additional log files to monitor? 
1. yes 
2. no 
default choice: [1]: 

Saved config file to /opt/aws/amazon-cloudwatch-agent/bin/config.json successfully. 
Current config as follows: 

        "agent": { 
                "metrics_collection_interval": 60, 
                "run_as_user": "root" 
        }, 
        "logs": { 
                "logs_collected": { 
                        "files": { 
                                "collect_list": [ 
                                        { 
                                                "file_path": "/var/log/messages", 
                                                "log_group_name": "messages", 
                                                "log_stream_name": "{instance_id}" 
                                        } 
                                ] 
                        } 
                } 
        }, 
        "metrics": { 
                "append_dimensions": { 
                        "AutoScalingGroupName": "${aws:AutoScalingGroupName}", 
                        "ImageId": "${aws:ImageId}", 
                        "InstanceId": "${aws:InstanceId}", 
                        "InstanceType": "${aws:InstanceType}" 
                }, 
                "metrics_collected": { 
                        "collectd": { 
                                "metrics_aggregation_interval": 60 
                        }, 
                        "cpu": { 
                                "measurement": [ 
                                        "cpu_usage_idle", 
                                        "cpu_usage_iowait", 
                                        "cpu_usage_user", 
                                        "cpu_usage_system" 
                                ], 
                                "metrics_collection_interval": 60, 
                                "resources": [ 
                                        "*" 
                                ], 
                                "totalcpu": false 
                        }, 
                        "disk": { 
                                "measurement": [ 
                                        "used_percent", 
                                        "inodes_free" 
                                ], 
                                "metrics_collection_interval": 60, 
                                "resources": [ 
                                        "*" 
                                ] 
                        }, 
                        "diskio": { 
                                "measurement": [ 
                                        "io_time", 
                                        "write_bytes", 
                                        "read_bytes", 
                                        "writes", 
                                        "reads" 
                                ], 
                                "metrics_collection_interval": 60, 
                                "resources": [ 
                                        "*" 
                                ] 
                        }, 
                        "mem": { 
                                "measurement": [ 
                                        "mem_used_percent" 
                                ], 
                                "metrics_collection_interval": 60 
                        }, 
                        "netstat": { 
                                "measurement": [ 
                                        "tcp_established", 
                                        "tcp_time_wait" 
                                ], 
                                "metrics_collection_interval": 60 
                        }, 
                        "statsd": { 
                                "metrics_aggregation_interval": 60, 
                                "metrics_collection_interval": 60, 
                                "service_address": ":8125" 
                        }, 
                        "swap": { 
                                "measurement": [ 
                                        "swap_used_percent" 
                                ], 
                                "metrics_collection_interval": 60 
                        } 
                } 
        } 

Please check the above content of the config. 
The config file is also located at /opt/aws/amazon-cloudwatch-agent/bin/config.json. 
Edit it manually if needed. 
Do you want to store the config in the SSM parameter store? 
1. yes 
2. no 
default choice: [1]: 

What parameter store name do you want to use to store your config? (Use 'AmazonCloudWatch-' prefix if you use our managed AWS policy) 
default choice: [AmazonCloudWatch-linux] 
 
Trying to fetch the default region based on ec2 metadata... 
Which region do you want to store the config in the parameter store? 
default choice: [ap-northeast-1] 
 
Which AWS credential should be used to send json config to parameter store? 
1. ASIAUJQZRURB4JXS2J6N(From SDK) 
2. Other 
default choice: [1]: 
 
Successfully put config to parameter store AmazonCloudWatch-linux. 
Program exits now. 
[root@CentOS7 bin]#


CloudWatch エージェントのステータスを確認します。

■CloudWatch エージェントのステータス確認

[root@CentOS7 bin]# /opt/aws/amazon-cloudwatch-agent/bin/amazon-cloudwatch-agent-ctl -m ec2 -a status 

  "status": "stopped", 
  "starttime": "", 
  "version": "1.227496.0" 

[root@CentOS7 bin]#


CloudWatch エージェントを起動します。

■CloudWatch エージェントの起動(コンフィグを指定して起動する)

[root@CentOS7 amazon-cloudwatch-agent.d]# /opt/aws/amazon-cloudwatch-agent/bin/amazon-cloudwatch-agent-ctl -a fetch-config -m ec2 -c file:/opt/aws/amazon-cloudwatch-agent/bin/config.json -s 
/opt/aws/amazon-cloudwatch-agent/bin/config-downloader --output-dir /opt/aws/amazon-cloudwatch-agent/etc/amazon-cloudwatch-agent.d --download-source file:/opt/aws/amazon-cloudwatch-agent/bin/config.json --mode ec2 --config /opt/aws/amazon-cloudwatch-agent/etc/common-config.toml --multi-config default 
Successfully fetched the config and saved in /opt/aws/amazon-cloudwatch-agent/etc/amazon-cloudwatch-agent.d/file_config.json.tmp 
Start configuration validation... 
/opt/aws/amazon-cloudwatch-agent/bin/config-translator --input /opt/aws/amazon-cloudwatch-agent/etc/amazon-cloudwatch-agent.json --input-dir /opt/aws/amazon-cloudwatch-agent/etc/amazon-cloudwatch-agent.d --output /opt/aws/amazon-cloudwatch-agent/etc/amazon-cloudwatch-agent.toml --mode ec2 --config /opt/aws/amazon-cloudwatch-agent/etc/common-config.toml --multi-config default 
2019/09/16 08:18:25 Reading json config file path: /opt/aws/amazon-cloudwatch-agent/etc/amazon-cloudwatch-agent.d/file_config.json.tmp ... 
Valid Json input schema. 
I! Detecting runasuser... 
No csm configuration found. 
Configuration validation first phase succeeded 
/opt/aws/amazon-cloudwatch-agent/bin/amazon-cloudwatch-agent -schematest -config /opt/aws/amazon-cloudwatch-agent/etc/amazon-cloudwatch-agent.toml 
Configuration validation second phase succeeded 
Configuration validation succeeded 
Redirecting to /bin/systemctl restart amazon-cloudwatch-agent.service 
[root@CentOS7 amazon-cloudwatch-agent.d]#


※失敗パターン

■CloudWatch エージェントの起動(コンフィグを読んでくれないのでログ取得ができない)

[root@CentOS7 bin]# /opt/aws/amazon-cloudwatch-agent/bin/amazon-cloudwatch-agent-ctl -m ec2 -a start 
amazon-cloudwatch-agent is not configured. Applying default configuration before starting it. 
/opt/aws/amazon-cloudwatch-agent/bin/config-downloader --output-dir /opt/aws/amazon-cloudwatch-agent/etc/amazon-cloudwatch-agent.d --download-source default --mode ec2 --config /opt/aws/amazon-cloudwatch-agent/etc/common-config.toml --multi-config default 
Successfully fetched the config and saved in /opt/aws/amazon-cloudwatch-agent/etc/amazon-cloudwatch-agent.d/default.tmp 
Start configuration validation... 
/opt/aws/amazon-cloudwatch-agent/bin/config-translator --input /opt/aws/amazon-cloudwatch-agent/etc/amazon-cloudwatch-agent.json --input-dir /opt/aws/amazon-cloudwatch-agent/etc/amazon-cloudwatch-agent.d --output /opt/aws/amazon-cloudwatch-agent/etc/amazon-cloudwatch-agent.toml --mode ec2 --config /opt/aws/amazon-cloudwatch-agent/etc/common-config.toml --multi-config default 
2019/09/16 06:47:14 Reading json config file path: /opt/aws/amazon-cloudwatch-agent/etc/amazon-cloudwatch-agent.d/default.tmp ... 
Valid Json input schema. 
I! Detecting runasuser... 
No csm configuration found. 
No log configuration found. 
Configuration validation first phase succeeded 
/opt/aws/amazon-cloudwatch-agent/bin/amazon-cloudwatch-agent -schematest -config /opt/aws/amazon-cloudwatch-agent/etc/amazon-cloudwatch-agent.toml 
Configuration validation second phase succeeded 
Configuration validation succeeded 
Created symlink from /etc/systemd/system/multi-user.target.wants/amazon-cloudwatch-agent.service to /etc/systemd/system/amazon-cloudwatch-agent.service. 
Redirecting to /bin/systemctl restart amazon-cloudwatch-agent.service 
[root@CentOS7 bin]#


上記コマンドではコンフィグ(/opt/aws/amazon-cloudwatch-agent/bin/config.json)を指定していないためか CloudWatch ログを取得できませんでした。


■原因

amazon-cloudwatch-agent-config-wizard コマンドで設定を作りますが、その後失敗したパターンのように単純に「amazon-cloudwatch-agent」エージェントを起動しただけでは、直前に amazon-cloudwatch-agent-config-wizard コマンドで設定した値が反映されません。

そのため、一度「/opt/aws/amazon-cloudwatch-agent/bin/amazon-cloudwatch-agent-ctl -a fetch-config -m ec2 -c file:/opt/aws/amazon-cloudwatch-agent/bin/config.json -s 」コマンドで設定を読み込む必要があります。

このコマンドで「/opt/aws/amazon-cloudwatch-agent/etc/amazon-cloudwatch-agent.toml」「/opt/aws/amazon-cloudwatch-agent/etc/amazon-cloudwatch-agent.d/file_config.json」が更新されます。


再度 CloudWatch エージェントのステータスを確認します。

■CloudWatch エージェントのステータス確認

[root@CentOS7 bin]# /opt/aws/amazon-cloudwatch-agent/bin/amazon-cloudwatch-agent-ctl -m ec2 -a status 

  "status": "running", 
  "starttime": "2019-09-16T06:47:14+0000", 
  "version": "1.227496.0" 

[root@CentOS7 bin]#


amazon-cloudwatch-agent-ctl コマンド

■amazon-cloudwatch-agent-ctl コマンドのヘルプ

[root@CentOS7 ~]# amazon-cloudwatch-agent-ctl -help 
 
 usage: amazon-cloudwatch-agent-ctl -a stop|start|status|fetch-config|append-config|remove-config [-m ec2|onPremise|auto] [-c default|ssm:|file:] [-s] 
 
 e.g. 
 1. apply a SSM parameter store config on EC2 instance and restart the agent afterwards: 
     amazon-cloudwatch-agent-ctl -a fetch-config -m ec2 -c ssm:AmazonCloudWatch-Config.json -s 
 2. append a local json config file on onPremise host and restart the agent afterwards: 
     amazon-cloudwatch-agent-ctl -a append-config -m onPremise -c file:/tmp/config.json -s 
 3. query agent status: 
     amazon-cloudwatch-agent-ctl -a status 
 
  -a: action 
      stop:                    stop the agent process. 
      start:                   start the agent process. 
      status:                  get the status of the agent process. 
      fetch-config:            use this json config as the agent's only configuration. 
                               このjson configをエージェントの唯一の構成として使用します。
      append-config:           append json config with the existing json configs if any. 

                               既存のjson構成があれば、json構成を追加します。
      remove-config:           remove json config based on the location (ssm parameter store name, file name) 

                               場所(ssmパラメーターストア名、ファイル名)に基づいてjson構成を削除します
 
  -m: mode 
      ec2:                     indicate this is on ec2 host. 

                               これがec2ホスト上にあることを示します。
      onPremise:               indicate this is on onPremise host. 

                               これがオンプレミスホスト上にあることを示します。
      auto:                    use ec2 metadata to determine the environment, may not be accurate if ec2 metadata is not available for some reason on EC2. 

                              ec2メタデータを使用して環境を決定します。EC2で何らかの理由でec2メタデータが利用できない場合、正確でない可能性があります。
 
  -c: configuration 
      default:                 default configuration for quick trial. 

                               クイックトライアル用のデフォルト設定。
      ssm::                    ssm parameter store name 

                               ssmパラメーターストア名
      file::                   file path on the host 
                               ホスト上のファイルパス
  -s: optionally restart after configuring the agent configuration 
      this parameter is used for 'fetch-config', 'append-config', 'remove-config' action only. 

   オプションで、エージェント構成の構成後に再起動します。
   このパラメーターは、「fetch-config」、「append-config」、「remove-config」アクションにのみ使用されます。


[root@CentOS7 ~]#


systemctl コマンドでの起動・停止・ステータス確認

■ステータス確認(停止中)

[root@CentOS7 amazon-cloudwatch-agent.d]# systemctl status amazon-cloudwatch-agent.service -l 
● amazon-cloudwatch-agent.service - Amazon CloudWatch Agent 
   Loaded: loaded (/etc/systemd/system/amazon-cloudwatch-agent.service; enabled; vendor preset: disabled) 
   Active: inactive (dead) since Mon 2019-09-16 09:10:02 UTC; 2h 46min ago 
  Process: 17144 ExecStart=/opt/aws/amazon-cloudwatch-agent/bin/start-amazon-cloudwatch-agent (code=killed, signal=TERM) 
 Main PID: 17144 (code=killed, signal=TERM) 
 
Sep 16 08:18:25 CentOS7 systemd[1]: Started Amazon CloudWatch Agent. 
Sep 16 08:18:25 CentOS7 start-amazon-cloudwatch-agent[17144]: /opt/aws/amazon-cloudwatch-agent/etc/amazon-cloudwatch-agent.json does not exist or cannot read. Skipping it. 
Sep 16 08:18:25 CentOS7 start-amazon-cloudwatch-agent[17144]: Valid Json input schema. 
Sep 16 08:18:25 CentOS7 start-amazon-cloudwatch-agent[17144]: I! Detecting runasuser... 
Sep 16 08:18:25 CentOS7 start-amazon-cloudwatch-agent[17144]: 2019/09/16 08:18:25 I! AmazonCloudWatchAgent Version 1.227496.0. 
Sep 16 09:10:02 CentOS7 systemd[1]: Stopping Amazon CloudWatch Agent... 
Sep 16 09:10:02 CentOS7 systemd[1]: Stopped Amazon CloudWatch Agent. 
[root@CentOS7 amazon-cloudwatch-agent.d]#


■起動

[root@CentOS7 amazon-cloudwatch-agent.d]# systemctl start amazon-cloudwatch-agent.service
[root@CentOS7 amazon-cloudwatch-agent.d]#


■ステータス確認(起動中

[root@CentOS7 amazon-cloudwatch-agent.d]# systemctl status amazon-cloudwatch-agent.service -l 
● amazon-cloudwatch-agent.service - Amazon CloudWatch Agent 
   Loaded: loaded (/etc/systemd/system/amazon-cloudwatch-agent.service; enabled; vendor preset: disabled) 
   Active: active (running) since Mon 2019-09-16 11:58:01 UTC; 35s ago 
 Main PID: 28048 (amazon-cloudwat) 
   CGroup: /system.slice/amazon-cloudwatch-agent.service 
           mq28048 /opt/aws/amazon-cloudwatch-agent/bin/amazon-cloudwatch-agent -config /opt/aws/amazon-cloudwatch-agent/etc/amazon-cloudwatch-agent.toml -pidfile /opt/aws/amazon-cloudwatch-agent/var/amazon-cloudwatch-agent.pid 
 
Sep 16 11:58:01 CentOS7 systemd[1]: Started Amazon CloudWatch Agent. 
Sep 16 11:58:01 CentOS7 start-amazon-cloudwatch-agent[28048]: /opt/aws/amazon-cloudwatch-agent/etc/amazon-cloudwatch-agent.json does not exist or cannot read. Skipping it. 
Sep 16 11:58:01 CentOS7 start-amazon-cloudwatch-agent[28048]: Valid Json input schema. 
Sep 16 11:58:01 CentOS7 start-amazon-cloudwatch-agent[28048]: I! Detecting runasuser... 
Sep 16 11:58:01 CentOS7 start-amazon-cloudwatch-agent[28048]: 2019/09/16 11:58:01 I! AmazonCloudWatchAgent Version 1.227496.0. 
Sep 16 11:58:01 CentOS7 start-amazon-cloudwatch-agent[28048]: 2019/09/16 11:58:01 Seeked /var/log/messages - &{Offset:1286720 Whence:0} 
[root@CentOS7 amazon-cloudwatch-agent.d]#


■停止

[root@CentOS7 amazon-cloudwatch-agent.d]# systemctl stop amazon-cloudwatch-agent.service
[root@CentOS7 amazon-cloudwatch-agent.d]#


■再起動

[root@CentOS7 amazon-cloudwatch-agent.d]# systemctl restart amazon-cloudwatch-agent.service
[root@CentOS7 amazon-cloudwatch-agent.d]#


■登録状況の確認

[root@CentOS7 amazon-cloudwatch-agent.d]# systemctl list-unit-files amazon-cloudwatch-agent.service 
UNIT FILE                       STATE 
amazon-cloudwatch-agent.service enabled 
 
1 unit files listed. 
[root@CentOS7 amazon-cloudwatch-agent.d]#


■自動起動の登録

[root@CentOS7 amazon-cloudwatch-agent.d]# systemctl enable amazon-cloudwatch-agent.service
[root@CentOS7 amazon-cloudwatch-agent.d]#


動作確認

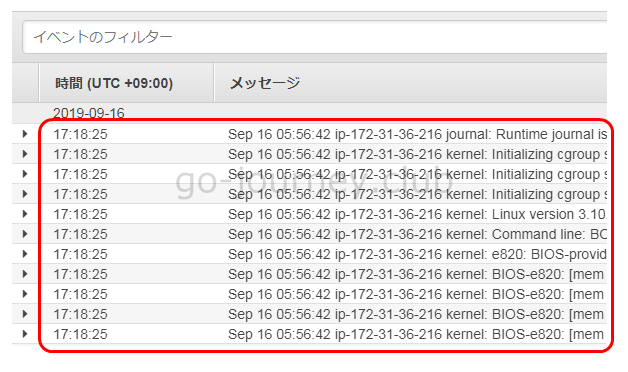
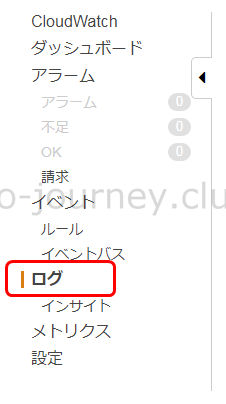
CloudWatch ダッシュボードに移動し、左側ペインより「ログ」を選択します。

【AWS】【AmazonLinux2】CloudWatch エージェントでログ監視をする設定手順【awslogsd】


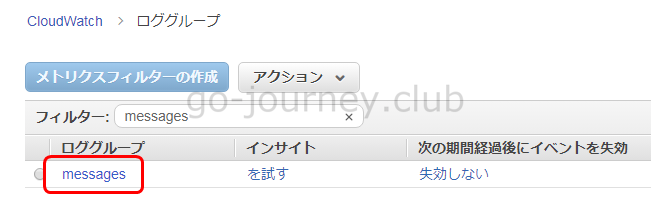
作成したロググループの「messages」をクリックします。

【AWS】【CentOS7】CloudWatch エージェントでログ監視をする設定手順


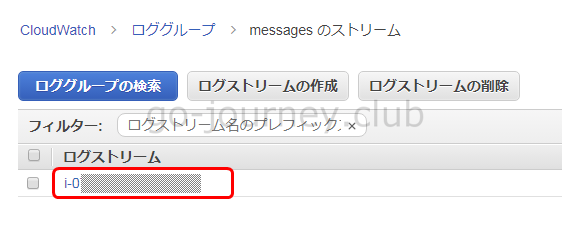
対象のログストリーム(インスタンスID)をクリックします。

【AWS】【CentOS7】CloudWatch エージェントでログ監視をする設定手順


下図のように /var/log/messages の内容を取得していることを確認します。

【AWS】【CentOS7】CloudWatch エージェントでログ監視をする設定手順


Posted by 100%レンタルサーバーを使いこなすサイト管理人

コメントを残す

メールアドレスが公開されることはありません。 が付いている欄は必須項目です

AlphaOmega Captcha Medica  –  What Do You See?


このサイトはスパムを低減するために Akismet を使っています。コメントデータの処理方法の詳細はこちらをご覧ください

Secured By miniOrange