今回はネットワーク周りで思うようにサーバーが動作しない時に確実に役立つトラブルシューティングのツールを紹介します。
ツールはパケットをダンプする「tcpdump」コマンドです。


例えば通常のドキュメントって綺麗に改行していたり、読みやすく成形しているけど、ダンプはそのままデータを吐き出しているから読みにくかったりするよ。
生のパケットの中身を確認できるようになると、今までなら諦めていたレンタルサーバー周りの設定だったり、自宅サーバーの設定、VPSや専用サーバーの設定が最後までできるようになります。
例えば、「ホームページが開けない」、「FTPでアクセスできない」、「名前解決ができない」などレンタルサーバーや自宅サーバー、VPSでホームページを運用しているといろんなトラブルが起きます。
しかし「tcpdump」というツールを使って調査することで原因の特定までできるようになります。
(すべてのトラブルを解決できるわけではありません)
tcpdumpコマンドとは
tcpdump コマンドは、指定したネットワークインターフエースを監視し、到達したパケットのデータを表示します。
tcpdumpコマンドは「理論」よりも「実践」です。
manコマンドで tcpdump コマンドを勉強しつつ、様々な例を試しつつ覚えるのが一番いいです。
tcpdumpインストール手順
tcpdumpコマンドはyumコマンドで簡単にインストールできます。
|
# yum install tcpdump |
tcpdump コマンド使い方
単純に tcpdump コマンドを実行するとプロミスキャスモードで動作します。
プロミスキャスモードとは「自分宛以外のパケットも受け取る状態」のことです。
下記は単純な tcpdump コマンドのみ実行した例です。
|
# tcpdump tcpdump: verbose output suppressed, use -v or -vv for full protocol decode listening on eth0, link-type EN10MB (Ethernet), capture size 65535 bytes 23:08:07.844408 IP tk2-xxx-xxx.vs.sakura.ne.jp.ssh > softbank126099xxxxxxx.bbtec.net.6905: Flags [P.], seq 179977145:179977385, ack 86209917, win 757, length 240 23:08:07.844994 IP tk2-xxx-xxx.vs.sakura.ne.jp.55070 > google-public-dns-a.google.com.domain: 62091+ PTR? 202.231.99.126.in-addr.arpa. (45) 23:08:07.849756 IP softbank126099xxxxxxx.bbtec.net.6905 > tk2-xxx-xxx.vs.sakura.ne.jp.ssh: Flags [.], ack 240, win 16266, length 0 23:08:07.882443 IP google-public-dns-a.google.com.domain > tk2-xxx-xxx.vs.sakura.ne.jp.55070: 62091 1/0/0 PTR softbank126099xxxxxxx.bbtec.net. (89) 23:08:07.882699 IP tk2-xxx-xxx.vs.sakura.ne.jp.58348 > google-public-dns-a.google.com.domain: 49586+ PTR? 115.217.16.160.in-addr.arpa. (45) 23:08:07.927224 ARP, Request who-has tk2-xxx-xxx.vs.sakura.ne.jp tell gateway, length 46 |
■コマンド構文
tcpdump[オプション][条件式]
■オプション解説
-i インターフェース キャプチャするインターフェースを指定します。
-q データの表示を簡易化します。
-s バイト数 パケットから取り出すバイト数を指定します。
-X データを16進数とASCII文字で表示します。
-n アドレスを名前解決せずに表示します。
-nn アドレスを名前解決せず、且つ、プロトコル名も表示せずにポート番号で表示します。
-N ホストのドメイン名を表示しません。
-l 標準出力をバッファリングします。
-t キャプチャしたデータの時刻を表示しません。
-v 詳細に出力します。
-w ファイル名 キャプチャしたデータをファイル名で出力します。
-a ネットワークアドレスの名前解決をして表示します。
-A キャプチャ↓データをASCII文字で表示します。
-p プロミスキャスモードにしません。つまり、自ホスト宛のパケットのみキャプチャします。
-c COUNT COUNT個のパケットを受信したら終了します。
■条件式解説
port ポート番号を指定します。
proto プロトコルを指定します。
例1 特定のポートのアクセスを解析したい
この例では、53番ポートへのアクセスのコマンド実行例です。
クライアント側は160.16.xxx.xxxで任意のポートを使用し、DNSサーバー8.8.8.8へ名前解決の問い合わせをしていることがわかります。
オプション -nn をつけることでIPアドレスもプロトコルも「番号」で表示されるようになりました。
こちらの方が分かりやすいですよね。
|
# tcpdump -nn port 53 23:29:50.748082 IP 160.16.xxx.xxx.41333 > 8.8.8.8.53: 35511+ A? google.co.jp. (30) 23:30:17.399857 IP 160.16.xxx.xxx.34166 > 8.8.8.8.53: 13182+ A? yahoo.co.jp. (29) 23:30:54.478579 IP 160.16.xxx.xxx.54041 > 8.8.8.8.53: 15820+ A? google.co.jp. (30) |
ちなみに上記のパケットは下記のコマンドを実行した際に出力されました。
|
$ nslookup google.co.jp Server: 8.8.8.8 Non-authoritative answer: $ nslookup yahoo.co.jp Non-authoritative answer: $ ping google.co.jp |
次は、80番ポートへのアクセスです。
|
# tcpdump -nn -i eth0 port 80 tcpdump: verbose output suppressed, use -v or -vv for full protocol decode |
フラグの見方
[S] → クライアントが「SYN」を送る
[S.] → サーバーが「SYN+ACK」を返す
[.] → クライアントが「ACK」を送る
[F.] → クライアントが送る「FIN+ACK」とサーバーが送る「FIN+ACK」
[P] → PUSHを送る
例2 SSHなど特定のポートを除外したい
例えば、teraterm でリモートるグインしている Linux サーバー上で tcpdump コマンドを実行すると、sshの通信でデータがいっぱいになり、本来調べたい通信の情報が埋もれてしまうことがあります。
その場合はssh(TCP/22)を除外しましょう。
not port [ポート番号]で除外できます。
|
# tcpdump -nn not port 22 tcpdump: verbose output suppressed, use -v or -vv for full protocol decode |
例3 ARPとSSHなど複数の特定のポートを除外したい
複数のポート、プロトコルを組み合わせて除外したい場合は、下記のように「and」でつなげます。
|
# tcpdump -nn -i eth0 not arp and not port 22 tcpdump: verbose output suppressed, use -v or -vv for full protocol decode |
例4 特定のプロトコルを指定したい
以下の各プロトコルを特定してキャプチャすることができます。
全部で16種類あります。
ether、fddi、mopdl、ip、ip6、arp、rarp、decnet、lat、sca、moprc、mopdl、icmp、icmp6、tcp、udpです。
使い方は「単純にプロトコルを書くだけ」です。
|
# tcpdump -nn -i eth0 icmp tcpdump: verbose output suppressed, use -v or -vv for full protocol decode |
例5 「tcpdump: packet printing is not supported for link type NFLOG: use -w」のエラーが出力された場合
例えば、複数 NIC を持っているサーバーで特定のIPアドレス「192.168.1.3」に絡むパケットを収集したい場合に、以下のようなエラーが出力されることがあります。
|
[root@test ~]# tcpdump | grep “192.168.1.3” |
man コマンドによると tcpdump コマンドで -i オプションを付けないで(インタフェースを指定しないで)実行した場合、システムのインターフェイスのリストから最も小さい番号で有効になっているもの(但しループバックは除く)を検索します。
tcpdump コマンドの man コマンド抜粋
|
-D Print the list of the network interfaces available on the system and on which tcpdump can capture packets. tcpdumpがパケットをキャプチャできる、システム上で利用可能なネットワークインタフェースのリストを出力します。 # tcpdump -D
For each network interface, a number and an interface name, possibly followed by a text description of the interface, is printed. 各ネットワークインターフェースには、番号とインターフェース名、場合によってはインターフェースのテキスト記述が続きます。 インターフェイス名または番号を -i フラグに指定すると、キャプチャするインターフェイスを指定できます。 This can be useful on systems that don’t have a command to list them (e.g., Windows systems, or UNIX systems lacking ifconfig -a); the number can be useful on Windows 2000 and later systems, where the interface name is a somewhat complex string. これは、リストするコマンドがないシステム(たとえば、Windows システム、または ifconfig -a がない UNIX システム)で役に立ちます。 この番号は、インターフェイス名がやや複雑な文字列であるWindows 2000以降のシステムで役立ちます。 The -D flag will not be supported if tcpdump was built with an older version of libpcap that lacks the pcap_findalldevs() function. tcpdump が pcap_findalldevs() 関数を持たない古いバージョンの libpcap で構築されている場合、-D フラグはサポートされません。
-i Listen on interface. If unspecified, tcpdump searches the system interface list for the lowest numbered, configured up interface (excluding loopback), which may turn out to be, for example, “eth0”. インターフェイスをチェックします。指定されていない場合、tcpdumpはシステムインタフェースリスト内で最も番号の小さい、設定されたインタフェース(ループバックを除く)を検索します。例えば “ eth0 ”となります。 On Linux systems with 2.2 or later kernels, an interface argument of “any” can be used to capture packets from all interfaces. Note that captures on the “any” device will not be done in promiscuous mode. 2.2 以降のカーネルを持つ Linux システムでは、 “ any ”というインタフェース引数を使用して、すべてのインタフェースからパケットを取得できます。 “ any ”デバイス上のキャプチャは、プロミスキャスモードでは行われないことに注意してください。 If the -D flag is supported, an interface number as printed by that flag can be used as the interface argument. -Dフラグがサポートされている場合は、そのフラグが出力するインターフェイス番号をインターフェイスの引数として使用できます。 |
■問題がないパターン
リストの一番上は「eth0」なので問題ありません。
|
[root@SAKURA_VPS conf]# tcpdump -D |
■問題があるパターン
以下はリストの一番上に「nflog (Linux netfilter log (NFLOG) interface)」が来るので -i で指定しないとエラーになります。
|
[root@test ~]# tcpdump -D |
■解決策
-i でリストの番号を指定するとうまく動きます。
|
[root@test ~]# tcpdump -i 3 | grep “192.168.1.3” |
キャプチャデータをWiresharkで見る
のちほど Wireshark でキャプチャデータを見たい場合は、オプション「-w [ファイル名]」を指定します。
|
# tcpdump -i eth0 -w test.cap |
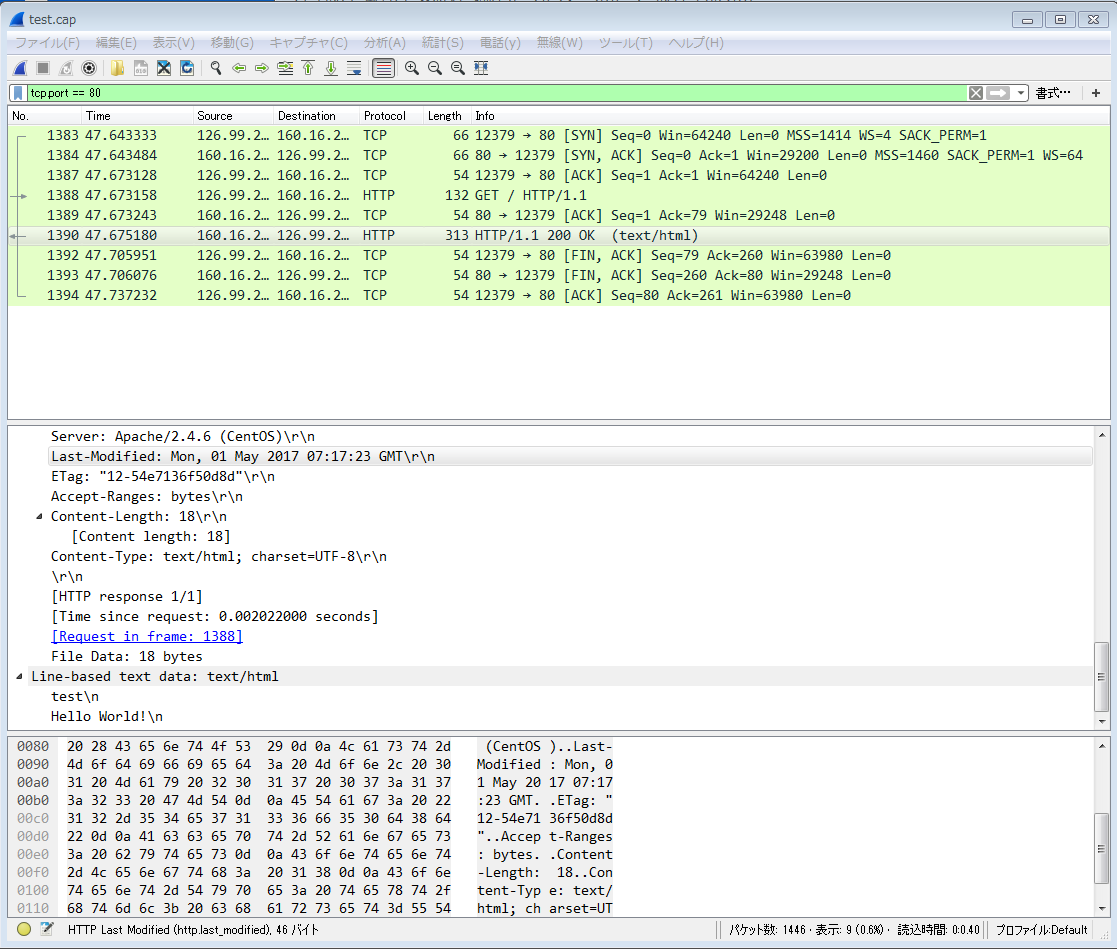
キャプチャしたデータを「Wireshark」で開くと下図のように見やすく成形されて表示されます。
下図は「tcp.port == 80」で80番ポートの通信のみが表示されるようにフィルタリングをしています。
例 特定のポートを絞り、ファイルとして出力したい
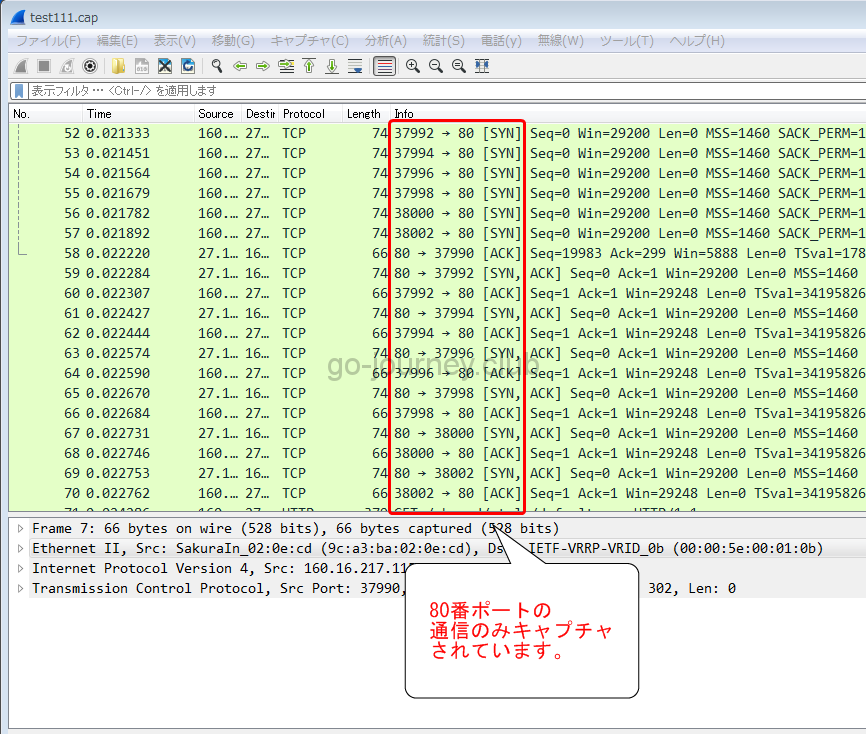
80番ポートだけをキャプチャし、ファイルとして出力したい場合です。
|
[root@SAKURA_VPS ~]# tcpdump port 80 -i eth0 -w test111.cap |
3.3MBのファイルが出力されました。
|
[root@SAKURA_VPS ~]# ls -lh test11.cap |
Wiresharkで内容を確認してみると80番ポートの通信のみキャプチャされています。
【補足】IPv6を使っていたので無効にする
tcpdumpを実行したらIPv6が有効になっており、tcpdumpの結果もIPv6で出力されました。
そのため見にくいため以下の手順でIPv6を無効にしています。
【変更前の設定】
|
# ifconfig # cat ifcfg-eth0 |
IPv6を無効にする手順【CentOS7】
現在の設定を確認します。
「/etc/sysctl.conf」ファイルを見ます。
|
# cat /etc/sysctl.conf # System default settings live in /usr/lib/sysctl.d/00-system.conf. # Do not accept RA |
気になるのが「Do not accept RA」です。
これはなんでしょうか。
RAとは「Router Advertisement(ルーター広告)」の略です。
広告と言っても、「コマーシャルなどの宣伝広告」とは異なり「知らせること、告知すること」の意味です。
「Router Advertisement」とは、IPv6アドレスの自動設定を行う機能です。
通常、アドレスの自動設定というと「DHCP」を想像しますが、IPv6の場合は「RA」と「RS(Router Solicitation、ルータ
「/etc/sysctl.conf」ファイルにIPv6を無効にする設定を入れます。
|
# vi /etc/sysctl.conf # System default settings live in /usr/lib/sysctl.d/00-system.conf. # Do not accept RA net.ipv6.conf.all.disable_ipv6 = 1 ← 追加する。 net.ipv6.conf.default.disable_ipv6 = 1 ← 追加する。 |
設定を反映します。
sysctlコマンドを実行すると読み込まれて有効になった設定の行が表示されます。
|
# sysctl -p net.ipv6.conf.default.accept_ra = 0 |
設定が反映されているか確認します。
inet6のアドレスが消えています。
|
# ifconfig eth0: flags=4163<UP,BROADCAST,RUNNING,MULTICAST> mtu 1500 |
man tcpdump(随時日本語化)
以下、迷った時の man コマンドです。
|
TCPDUMP(8) System Manager’s Manual TCPDUMP(8) NAME SYNOPSIS DESCRIPTION Tcpdumpは、ブール式と一致するネットワークインターフェイス上のパケットの内容の説明を出力します。 後で解析するためにパケット・データをファイルに保存する-wフラグ、またはパケットを読み取るのではなく保存されたパケット・ファイルから読み取る-rフラグを使用して実行することもできます ネットワークインターフェイスから。 -Vフラグを付けて実行すると、保存されたパケットファイルのリストを読み取ることができます。 Tcpdump will, if not run with the -c flag, continue capturing packets until it is interrupted by a SIGINT signal (generated, for example, by typing your interrupt character, typically control-C) or a SIGTERM signal (typically generated with the kill(1) command); if run with the -c flag, it will capture packets until it is interrupted by a SIGINT or SIGTERM signal or the specified number of packets have been processed. Tcpdumpは、-cフラグを付けて実行しないと、SIGINTシグナル(割り込み文字、通常はcontrol-Cをタイプすることによって生成される)またはSIGTERMシグナル(通常はkill (1)コマンド)。 -cフラグを付けて実行すると、SIGINTまたはSIGTERMシグナルによって中断されるか、または指定された数のパケットが処理されるまでパケットをキャプチャします。 When tcpdump finishes capturing packets, it will report counts of: tcpdumpがパケットのキャプチャを終了すると、次の数が報告されます。 packets “captured” (this is the number of packets that tcpdump has received and processed); “捕獲された ”パケット(これはtcpdumpが受信して処理したパケットの数です)。 packets “received by filter” (the meaning of this depends on the OS on which you’re running tcpdump, and possibly on the way the OS was configured – if a filter was specified on the command line, on some OSes it counts packets regardless of whether they were matched by the filter expression and, even if they were matched by the filter expression, regardless of whether tcpdump has read and processed them yet, on other OSes it counts only packets that were matched by the filter expression regardless of whether tcpdump has read and processed them yet, and on other OSes it counts only packets that were matched by the filter expression and were processed by tcpdump); パケットが「フィルタで受信されました」(この意味は、tcpdumpを実行しているOSによって異なりますが、OSが設定されている方法によっても異なります)。コマンドラインでフィルタが指定された場合、 tcpdumpがまだそれらを読み込んで処理しているかどうかにかかわらず、フィルタ式によって一致したかどうかにかかわらず、フィルタ式によって一致したかどうかにかかわらず、フィルタ式によって一致したパケットだけを数えます tcpdumpはそれをまだ読み込んで処理していますが、他のOSではフィルタ式と一致したパケットだけがカウントされ、tcpdumpで処理されます。 packets “dropped by kernel” (this is the number of packets that were dropped, due to a lack of buffer space, by the packet capture mechanism in the OS on which tcpdump is running, if the OS reports that information to applications; if not, it will be reported as 0). パケットが “カーネルによってドロップされた”(これは、バッファスペースが不足しているため、tcpdumpが実行されているOSのパケットキャプチャメカニズムによってドロップされたパケットの数です。 そうでない場合、0と報告されます)。 On platforms that support the SIGINFO signal, such as most BSDs (including Mac OS X) and Digital/Tru64 UNIX, it will report those counts when it receives a SIGINFO signal (generated, for example, by typing your “status” character, typically control-T, although on some platforms, such as Mac OS X, the “status” character is not set by default, so you must set it with stty(1) in order to use it) and will continue capturing packets. ほとんどのBSD(Mac OS Xを含む)やDigital / Tru64 UNIXなどのSIGINFOシグナルをサポートするプラットフォームでは、SIGINFOシグナルを受け取ったときにそれらのカウントを報告します(例えば、 “status” 文字的にはcontrol-Tですが、Mac OS Xのようないくつかのプラットフォームでは、 “status”文字はデフォルトでは設定されていないので、それを使用するにはstty(1)で設定しなければなりません)。 Reading packets from a network interface may require that you have special privileges; see the pcap (3PCAP) man page for details. Reading a saved packet file doesn’t require special privileges. ネットワークインタフェースからパケットを読み取るには、特別な権限が必要です。 詳細については、pcap(3PCAP)のマニュアルページを参照してください。 保存されたパケットファイルを読み取るのに特別な特権は必要ありません。 OPTIONS 各パケット(そのリンクレベルヘッダーを引いたもの)をASCIIで印刷します。 Webページをキャプチャするのに便利です。 -b Print the AS number in BGP packets in ASDOT notation rather than ASPLAIN notation. BGPパケットのAS番号を、ASPLAIN表記ではなくASDOT表記で表示します。 -B Set the operating system capture buffer size to buffer_size, in units of KiB (1024 bytes). オペレーティングシステムのキャプチャバッファサイズをKiB(1024バイト)の単位でbuffer_sizeに設定します。 -c Exit after receiving count packets. 指定した数のパケットを受信した後に終了します。 -C Before writing a raw packet to a savefile, check whether the file is currently larger than file_size and, if so, close the current savefile and open a new one. 生のパケットを保存ファイルに書き込む前に、ファイルが現在ファイルサイズよりも大きいかどうかをチェックし、もしあれば、現在の保存ファイルを閉じて新しいファイルを開きます。 ファイルの保存最初の保存ファイルの後に-wフラグで指定された名前が付いています。その後に1から始まり上向きの数字が続きます。 file_sizeの単位は、ミリオンバイト(1,000,000バイト、1,048,576バイトではありません)です。 Note that when used with -Z option (enabled by default), privileges are dropped before opening first savefile. -Zオプション(デフォルトで有効)と一緒に使用すると、最初のsavefileを開く前に特権が削除されることに注意してください。 -d Dump the compiled packet-matching code in a human readable form to standard output and stop. コンパイルされたパケットマッチングコードを人間が読める形式で標準出力にダンプして停止します。 -dd Dump packet-matching code as a C program fragment. パケットマッチングコードをCプログラムの断片としてダンプします。 -ddd Dump packet-matching code as decimal numbers (preceded with a count). パケットマッチングコードを10進数(ダンプカウントの前に)としてダンプします。 -D Print the list of the network interfaces available on the system and on which tcpdump can capture packets. tcpdumpがパケットをキャプチャできる、システム上で利用可能なネットワークインタフェースのリストを出力します。 # tcpdump -D 各ネットワークインターフェースには、番号とインターフェース名、場合によってはインターフェースのテキスト記述が続きます。 インターフェイス名または番号を -i フラグに指定すると、キャプチャするインターフェイスを指定できます。 This can be useful on systems that don’t have a command to list them (e.g., Windows systems, or UNIX systems lacking ifconfig -a); the number can be useful on Windows 2000 and later systems, where the interface name is a somewhat complex string. これは、リストするコマンドがないシステム(たとえば、Windows システム、または ifconfig -a がない UNIX システム)で役に立ちます。 この番号は、インターフェイス名がやや複雑な文字列であるWindows 2000以降のシステムで役立ちます。 The -D flag will not be supported if tcpdump was built with an older version of libpcap that lacks the pcap_findalldevs() function. tcpdump が pcap_findalldevs() 関数を持たない古いバージョンの libpcap で構築されている場合、-D フラグはサポートされません。 -e Print the link-level header on each dump line. This can be used, for example, to print MAC layer addresses for protocols such as Ethernet and IEEE 802.11. 各ダンプ行にリンクレベルのヘッダーを出力します。 これは、たとえば、イーサネットやIEEE 802.11などのプロトコルのMACレイヤアドレスを印刷するために使用できます。 -E Use spi@ipaddr algo:secret for decrypting IPsec ESP packets that are addressed to addr and contain Security Parameter Index value spi. This combination may be repeated with comma or newline separation. addrにアドレス指定され、セキュリティパラメータインデックス値spiを含むIPsec ESPパケットを解読するには、spi @ ipaddr algo:secretを使用します。 この組み合わせは、カンマまたは改行で繰り返すことができます。 Note that setting the secret for IPv4 ESP packets is supported at this time. この時点では、IPv4 ESPパケットの秘密の設定がサポートされています。 Algorithms may be des-cbc, 3des-cbc, blowfish-cbc, rc3-cbc, cast128-cbc, or none. The default is des-cbc. The ability to decrypt packets is only present if tcpdump was compiled with cryptography enabled. アルゴリズムは、des-cbc、3des-cbc、blowfish-cbc、rc3-cbc、cast128-cbc、またはnoneのいずれかです。 デフォルトはdes-cbcです。 パケットを解読する能力は、暗号化を有効にしてtcpdumpをコンパイルした場合にのみ存在します。 secret is the ASCII text for ESP secret key. If preceded by 0x, then a hex value will be read. secretは、ESP秘密鍵のASCIIテキストです。 0xが先行する場合、16進値が読み取られます。 The option assumes RFC2406 ESP, not RFC1827 ESP. The option is only for debugging purposes, and the use of this option with a true `secret’ key is discouraged. このオプションはRFC2406 ESPであり、RFC1827 ESPではありません。 このオプションはデバッグ目的にのみ使用され、このオプションを真の `secret ‘キーで使用することはお勧めしません。 コマンドラインにIPsec秘密鍵を提示することで、ps(1)や他の機会を通じて他の人に見えるようにすることができます。 In addition to the above syntax, the syntax file name may be used to have tcpdump read the provided file in. 上記の構文に加えて、tcpdumpが提供されたファイルを読み込むために構文ファイル名を使用することができます。 このファイルは、最初のESPパケットを受信したときに開かれるので、tcpdumpが与えられている可能性がある特別な権限は、すでに放棄されているはずです。 -f Print `foreign’ IPv4 addresses numerically rather than symbolically (this option is intended to get around serious brain damage in Sun’s NIS server ― usually it hangs forever translating non-local internet numbers). The test for `foreign’ IPv4 addresses is done using the IPv4 address and netmask of the interface on which capture is being done. シンボリックではなく数値的に `foreign ‘IPv4アドレスを表示します(このオプションは、SunのNISサーバーで重大な脳障害を回避するためのものです。通常、非ローカルインターネット番号の翻訳は永久に停止します)。 キャプチャが実行されているインタフェースにアドレスまたはネットマスクがないか、またはキャプチャが複数のインタフェースでキャプチャできるLinuxの「any」インタフェースで実行されているために、そのアドレスまたはネットマスクが使用可能でない場合は、 このオプションは正しく動作しません。 -F Use file as input for the filter expression. An additional expression given on the command line is ignored. フィルター式の入力としてfileを使用します。 コマンドラインで与えられた追加の式は無視されます。 -G If specified, rotates the dump file specified with the -w option every rotate_seconds seconds. 指定すると、-wオプションで指定されたダンプ・ファイルをrotate_seconds秒ごとにローテートします。 セーブファイルは、-wで指定された名前を持ちます。このファイルには、strftime(3)で定義されている時刻書式を含める必要があります。 時刻形式が指定されていない場合、新しいファイルはそれぞれ前のファイルを上書きします。 If used in conjunction with the -C option, filenames will take the form of `file<count>’. -Cオプションと組み合わせて使用すると、ファイル名は `file <count> ‘の形式になります。 -h Print the tcpdump and libpcap version strings, print a usage message, and exit. tcpdumpとlibpcapのバージョン文字列を表示し、使用法のメッセージを出力して終了します。 -H Attempt to detect 802.11s draft mesh headers. 802.11sドラフトメッシュヘッダーを検出しようと試みます。 -i Listen on interface. If unspecified, tcpdump searches the system interface list for the lowest numbered, configured up interface (excluding loopback), which may turn out to be, for example, “eth0”. インターフェイスをチェックします。指定されていない場合、tcpdumpはシステムインタフェースリスト内で最も番号の小さい、設定されたインタフェース(ループバックを除く)を検索します。例えば “ eth0 ”となります。 On Linux systems with 2.2 or later kernels, an interface argument of “any” can be used to capture packets from all interfaces. Note that captures on the “any” device will not be done in promiscuous mode. 2.2 以降のカーネルを持つ Linux システムでは、 “ any ”というインタフェース引数を使用して、すべてのインタフェースからパケットを取得できます。 “ any ”デバイス上のキャプチャは、プロミスキャスモードでは行われないことに注意してください。 If the -D flag is supported, an interface number as printed by that flag can be used as the interface argument. -Dフラグがサポートされている場合は、そのフラグが出力するインターフェイス番号をインターフェイスの引数として使用できます。 -I Put the interface in “monitor mode”; this is supported only on IEEE 802.11 Wi-Fi interfaces, and supported only on some operating systems. インタフェースを「モニタモード」にします。これはIEEE 802.11 Wi-Fiインターフェイスでのみサポートされており、一部のオペレーティングシステムでのみサポートされています。 Note that in monitor mode the adapter might disassociate from the network with which it’s associated, so that you will not be able to use any wireless networks with that adapter. This could prevent accessing files on a network server, or resolving host names or network addresses, if you are capturing in monitor mode and are not connected to another network with another adapter. モニターモードでは、アダプターは、関連付けられているネットワークとの関連付けを解除することがあります。そのため、そのアダプターではワイヤレスネットワークを使用できなくなります。 これにより、モニター・モードでキャプチャーしていて、別のアダプターで別のネットワークに接続していない場合に、ネットワーク・サーバー上のファイルへのアクセスやホスト名またはネットワーク・アドレスの解決を妨げる可能性があります。 This flag will affect the output of the -L flag. If -I isn’t specified, only those link-layer types available when not in monitor mode will be shown; if -I is specified, only those link-layer types available when in monitor mode will be shown. このフラグは、-Lフラグの出力に影響します。 -Iが指定されていない場合、モニタモードではないときに利用可能なリンク層タイプのみが表示されます。 -Iを指定すると、モニタモード時に使用可能なリンクレイヤタイプのみが表示されます。 -j Set the time stamp type for the capture to tstamp_type. The names to use for the time stamp types are given in pcap-tstamp-type(7); not all the types listed there will necessarily be valid for any given interface. キャプチャのタイムスタンプのタイプをtstamp_typeに設定します。 タイムスタンプタイプに使用する名前はpcap-tstamp-type(7)で与えられます。 そこにリストされているすべてのタイプが、特定のインタフェースに対して必ずしも有効であるとは限りません。 -J List the supported time stamp types for the interface and exit. If the time stamp type cannot be set for the interface, no time stamp types are listed. インタフェースにサポートされているタイムスタンプのタイプをリストして終了します。 タイムスタンプタイプをインターフェースに設定できない場合は、タイムスタンプタイプはリストされません。 –time-stamp-precision=tstamp_precision キャプチャを行うときは、キャプチャのタイムスタンプ精度をtstamp_precisionに設定します。 高精度タイムスタンプ(ナノ秒)の利用可能性とその実際の精度は、プラットフォームおよびハードウェアに依存することに注意してください。 また、ナノ秒の精度でキャプチャを保存ファイルに書き込む場合、タイムスタンプはナノ秒の分解能で書き込まれ、ファイルには別のマジックナンバーが書き込まれ、タイムスタンプが秒とナノ秒であることを示します。 pcap savefilesを読み取るすべてのプログラムがこれらのキャプチャを読み取ることはできません。 When reading a savefile, convert time stamps to the precision specified by timestamp_precision, and display them with that resolution. 保存ファイルを読み込むときは、タイムスタンプをtimestamp_precisionで指定された精度に変換し、その解像度で表示します。 The supported values for timestamp_precision are micro for microsecond resolution and nano for nanosecond resolution. The default is microsecond resolution. timestamp_precisionでサポートされている値は、マイクロ秒の解像度ではマイクロ秒、ナノ秒の解像度ではナノ秒です。 デフォルトはマイクロ秒の解像度です。 -K Don’t attempt to verify IP, TCP, or UDP checksums. This is useful for interfaces that perform some or all of those checksum calculation in hardware; otherwise, all outgoing TCP checksums will be flagged as bad. IP、TCP、またはUDPのチェックサムを検証しないでください。 これは、ハードウェアでこれらのチェックサム計算の一部またはすべてを実行するインターフェイスで役に立ちます。 さもなければ、すべての発信TCPチェックサムは不良としてフラグが立てられます。 -l Make stdout line buffered. Useful if you want to see the data while capturing it. E.g., 例えば or tcpdump -l > dat & tail -f dat Note that on Windows,“line buffered” means “unbuffered”, so that WinDump will write each character individually if -l is specified. Windowsでは、 “バッファリングされた ”は “バッファなし ”を意味するので、-lが指定されている場合、WinDumpは個々の文字を個別に書き込みます。 -U is similar to -l in its behavior, but it will cause output to be “packet-buffered”, so that the output is written to stdout at the end of each packet rather than at the end of each line; this is buffered on all platforms, including Windows. -Uはその動作において-lと似ていますが、出力が “パケットバッファリング ”になるので、出力は各行の終わりではなく各パケットの終わりでstdoutに書き込まれます。 これはWindowsを含むすべてのプラットフォームでバッファリングされます。 -L List the known data link types for the interface, in the specified mode, and exit. インターフェイスの既知のデータリンクタイプを指定されたモードで一覧表示して終了します。 既知のデータリンクタイプのリストは、指定されたモードに依存する可能性があります。 たとえば、一部のプラットフォームでは、Wi-Fiインターフェイスは、モニタモードではないときに、1組のデータリンクタイプをサポートしている可能性があります(たとえば、偽のイーサネットヘッダーのみをサポートしている場合もあれば、802.11ヘッダーをサポートしていても、 )と、モニタモードのときに別のデータリンクタイプのセット(たとえば、モニタ情報のみの802.11ヘッダーまたは無線情報付きの802.11ヘッダーをサポートする場合など)。 -m Load SMI MIB module definitions from file module. This option can be used several times to load several MIB modules into tcpdump. ファイルモジュールからSMI MIBモジュール定義をロードします。 このオプションを使用すると、複数のMIBモジュールをtcpdumpにロードすることができます。 -M Use secret as a shared secret for validating the digests found in TCP segments with the TCP-MD5 option (RFC 2385), if present. 存在する場合、TCP-MD5オプション(RFC 2385)を使用してTCPセグメント内にあるダイジェストを検証するために、シークレットを共有秘密として使用します。 -n Don’t convert host addresses to names. This can be used to avoid DNS lookups. -nn Don’t convert protocol and port numbers etc. to names either. -N Don’t print domain name qualification of host names. E.g., if you give this flag then tcpdump will print “nic” instead of “nic.ddn.mil”. -O Do not run the packet-matching code optimizer. This is useful only if you suspect a bug in the optimizer. -p Don’t put the interface into promiscuous mode. Note that the interface might be in promiscuous mode for some other reason; hence, `-p’ cannot be used as an abbreviation for `ether host {local-hw-addr} or ether broadcast’. -P Choose send/receive direction direction for which packets should be captured. Possible values are `in’, `out’ and `inout’. Not available on all platforms. -q Quick (quiet?) output. Print less protocol information so output lines are shorter. -R Assume ESP/AH packets to be based on old specification (RFC1825 to RFC1829). If specified, tcpdump will not print replay prevention field. Since there is no protocol version field in ESP/AH specification, tcpdump cannot deduce the version of ESP/AH protocol. -r Read packets from file (which was created with the -w option). Standard input is used if file is “-”. -S Print absolute, rather than relative, TCP sequence numbers. -s Snarf snaplen bytes of data from each packet rather than the default of 65535 bytes. -T Force packets selected by “expression” to be interpreted the specified type. Note that the pgm type above affects UDP interpretation only, the native PGM is always recognised as IP protocol 113 regardless. UDP-encapsulated PGM is often called “EPGM” or “PGM/UDP”. Note that the pgm_zmtp1 type above affects interpretation of both native PGM and UDP at once. -t Don’t print a timestamp on each dump line. -tt Print an unformatted timestamp on each dump line. -ttt Print a delta (micro-second resolution) between current and previous line on each dump line. -tttt Print a timestamp in default format proceeded by date on each dump line. -ttttt Print a delta (micro-second resolution) between current and first line on each dump line. -u Print undecoded NFS handles. -U If the -w option is not specified, make the printed packet output “packet-buffered”; i.e., as the description of the contents of each packet is printed, it will be written to the standard output, rather than, when not writing to a terminal, being written only when the output buffer fills. If the -w option is specified, make the saved raw packet output “packet-buffered”; i.e., as each packet is saved, it will be written to the output file, rather than being written only when the output buffer fills. The -U flag will not be supported if tcpdump was built with an older version of libpcap that lacks the pcap_dump_flush() function. -v When parsing and printing, produce (slightly more) verbose output. For example, the time to live, identification, total length and options in an IP packet are printed. Also enables additional packet integrity checks such as verifying the IP and ICMP header checksum. When writing to a file with the -w option, report, every 10 seconds, the number of packets captured. -vv Even more verbose output. For example, additional fields are printed from NFS reply packets, and SMB packets are fully decoded. -vvv Even more verbose output. For example, telnet SB … SE options are printed in full. With -X Telnet options are printed in hex as well. -V Read a list of filenames from file. Standard input is used if file is “-”. -w Write the raw packets to file rather than parsing and printing them out. They can later be printed with the -r option. Standard output is used if file is “-”. This output will be buffered if written to a file or pipe, so a program reading from the file or pipe may not see packets for an arbitrary amount of time after they are received. The MIME type application/vnd.tcpdump.pcap has been registered with IANA for pcap files. See pcap-savefile(5) for a description of the file format. -W Used in conjunction with the -C option, this will limit the number of files created to the specified number, and begin overwriting files from the beginning, thus creating a ‘rotating’ buffer. Used in conjunction with the -G option, this will limit the number of rotated dump files that get created, exiting with status 0 when reaching the limit. -x When parsing and printing, in addition to printing the headers of each packet, print the data of each packet (minus its link level header) in hex. -xx When parsing and printing, in addition to printing the headers of each packet, print the data of each packet, including its link level header, in hex. -X When parsing and printing, in addition to printing the headers of each packet, print the data of each packet (minus its link level header) in hex and ASCII. This is very handy for analysing new protocols. -XX When parsing and printing, in addition to printing the headers of each packet, print the data of each packet, including its link level header, in hex and ASCII. -y Set the data link type to use while capturing packets to datalinktype. -z Used in conjunction with the -C or -G options, this will make tcpdump run ” command file ” where file is the savefile being closed after each rotation. Note that tcpdump will run the command in parallel to the capture, using the lowest priority so that this doesn’t disturb the capture process. And in case you would like to use a command that itself takes flags or different arguments, you can always write a shell script that will take the savefile name as the only argument, make the flags & arguments arrangements and execute the command that you want. -Z If tcpdump is running as root, after opening the capture device or input savefile, but before opening any savefiles for output, change the user ID to user and the group ID to the primary group of user. This behavior is enabled by default (-Z tcpdump), and can be disabled by -Z root.
expression For the expression syntax, see pcap-filter(7). The expression argument can be passed to tcpdump as either a single Shell argument, or as multiple Shell arguments, whichever is more convenient. EXAMPLES To print traffic between helios and either hot or ace: To print all IP packets between ace and any host except helios: To print all traffic between local hosts and hosts at Berkeley: To print all ftp traffic through internet gateway snup: (note that the expression is quoted to prevent the shell from (mis-)interpreting the parentheses): To print traffic neither sourced from nor destined for local hosts (if you gateway to one other net, this stuff should never make it onto your local net). To print the start and end packets (the SYN and FIN packets) of each TCP conversation that involves a non-local host. To print all IPv4 HTTP packets to and from port 80, i.e. print only packets that contain data, not, for example, SYN and FIN packets and ACK-only packets. (IPv6 is left as an exercise for the reader.) To print IP packets longer than 576 bytes sent through gateway snup: To print IP broadcast or multicast packets that were not sent via Ethernet broadcast or multicast: To print all ICMP packets that are not echo requests/replies (i.e., not ping packets): OUTPUT FORMAT Link Level Headers If the ‘-e’ option is given, the link level header is printed out. On Ethernets, the source and destination addresses, protocol, and packet length are printed. On FDDI networks, the ‘-e’ option causes tcpdump to print the `frame control’ field, the source and destination addresses, and the packet length. On Token Ring networks, the ‘-e’ option causes tcpdump to print the `access control’ and `frame control’ fields, the source and destination addresses, and the packet length. As on FDDI networks, packets are assumed to contain an LLC packet. On 802.11 networks, the ‘-e’ option causes tcpdump to print the `frame control’ fields, all of the addresses in the 802.11 header, and the packet length. As on FDDI networks, packets are assumed to contain an LLC packet. (N.B.: The following description assumes familiarity with the SLIP compression algorithm described in RFC-1144.) On SLIP links, a direction indicator (“I” for inbound, “O” for outbound), packet type, and compression information are printed out. For example, the following line shows an outbound compressed TCP packet, with an implicit connection identifier; the ack has changed by 6, the sequence number by 49, and the packet ID by 6; there are 3 bytes of data and 6 bytes of compressed header: ARP/RARP Packets Arp/rarp output shows the type of request and its arguments. This would look less redundant if we had done tcpdump -n: If we had done tcpdump -e, the fact that the first packet is broadcast and the second is point-to-point would be visible: TCP Packets (N.B.:The following description assumes familiarity with the TCP protocol described in RFC-793. If you are not familiar with the protocol, neither this description nor tcpdump will be of much use to you.) The general format of a tcp protocol line is: Src, dst and flags are always present. Here is the opening portion of an rlogin from host rtsg to host csam. Csam replies with a similar packet except it includes a piggy-backed ack for rtsg’s SYN. Rtsg then acks csam’s SYN. On the 6th line, rtsg sends csam 19 bytes of data (bytes 2 through 20 in the rtsg → csam side of the conversation). The PUSH flag is set in the packet. If the snapshot was small enough that tcpdump didn’t capture the full TCP header, it interprets as much of the header as it can and then reports “[|tcp]” to indicate the remainder could not be interpreted. Capturing TCP packets with particular flag combinations (SYN-ACK, URG-ACK, etc.) There are 8 bits in the control bits section of the TCP header: CWR | ECE | URG | ACK | PSH | RST | SYN | FIN Let’s assume that we want to watch packets used in establishing a TCP connection. 1) Caller sends SYN Now we’re interested in capturing packets that have only the SYN bit set (Step 1). Recall the structure of a TCP header without options: 0 15 31 A TCP header usually holds 20 octets of data, unless options are present. Starting to count with 0, the relevant TCP control bits are contained in octet 13: 0 7| 15| 23| 31 Let’s have a closer look at octet no. 13: | | These are the TCP control bits we are interested in. We have numbered the bits in this octet from 0 to 7, right to left, so the PSH bit is bit number 3, while the URG bit is number 5. Recall that we want to capture packets with only SYN set. Let’s see what happens to octet 13 if a TCP datagram arrives with the SYN bit set in its header: |C|E|U|A|P|R|S|F| Looking at the control bits section we see that only bit number 1 (SYN) is set. Assuming that octet number 13 is an 8-bit unsigned integer in network byte order, the binary value of this octet is 00000010 and its decimal representation is 7 6 5 4 3 2 1 0 We’re almost done, because now we know that if only SYN is set, the value of the 13th octet in the TCP header, when interpreted as a 8-bit unsigned integer in network byte order, must be exactly 2. This relationship can be expressed as We can use this expression as the filter for tcpdump in order to watch packets which have only SYN set: The expression says “let the 13th octet of a TCP datagram have the decimal value 2”, which is exactly what we want. Now, let’s assume that we need to capture SYN packets, but we don’t care if ACK or any other TCP control bit is set at the same time. Let’s see what happens to octet 13 when a TCP datagram with SYN-ACK set arrives: |C|E|U|A|P|R|S|F| Now bits 1 and 4 are set in the 13th octet. The binary value of octet 13 is 00010010 which translates to decimal 7 6 5 4 3 2 1 0 Now we can’t just use ‘tcp[13] == 18’ in the tcpdump filter expression, because that would select only those packets that have SYN-ACK set, but not those with only SYN set. Remember that we don’t care if ACK or any other control bit is set as long as SYN is set. In order to achieve our goal, we need to logically AND the binary value of octet 13 with some other value to preserve the SYN bit. We know that we want SYN to be set in any case, so we’ll logically AND the value in the 13th octet with the binary value of a SYN: 00010010 SYN-ACK 00000010 SYN We see that this AND operation delivers the same result regardless whether ACK or another TCP control bit is set. ( ( value of octet 13 ) AND ( 2 ) ) == ( 2 ) This points us to the tcpdump filter expression Some offsets and field values may be expressed as names rather than as numeric values. This can be demonstrated as: Note that you should use single quotes or a backslash in the expression to hide the AND (‘&’) special character from the shell. UDP Packets UDP format is illustrated by this rwho packet: Some UDP services are recognized (from the source or destination port number) and the higher level protocol information printed. UDP Name Server Requests (N.B.:The following description assumes familiarity with the Domain Service protocol described in RFC-1035. Name server requests are formatted as A few anomalies are checked and may result in extra fields enclosed in square brackets: If a query contains an answer, authority records or additional records section, ancount, nscount, or arcount are printed as `[na]’, `[nn]’ or `[nau]’ where n is the appropriate count. UDP Name Server Responses Name server responses are formatted as In the second example, helios responds to query 2 with a response code of non-existent domain (NXDomain) with no answers, one name server and no authority records. Other flag characters that might appear are `-‘ (recursion available, RA, not set) and `|’ (truncated message, TC, set). If the `question’ section doesn’t contain exactly one entry, `[nq]’ is printed. SMB/CIFS decoding tcpdump now includes fairly extensive SMB/CIFS/NBT decoding for data on UDP/137, UDP/138 and TCP/139. Some primitive decoding of IPX and NetBEUI SMB data is also done. By default a fairly minimal decode is done, with a much more detailed decode done if -v is used. For information on SMB packet formats and what all the fields mean see www.cifs.org or the pub/samba/specs/ directory on your favorite samba.org mirror site. NFS Requests and Replies Sun NFS (Network File System) requests and replies are printed as: In the third line, sushi asks wrl to lookup the name `xcolors’ in directory file 9,74/4096.6878. If the -v (verbose) flag is given, additional information is printed. For example: If the -v flag is given more than once, even more details are printed. Note that NFS requests are very large and much of the detail won’t be printed unless snaplen is increased. Try using `-s 192′ to watch NFS traffic. NFS reply packets do not explicitly identify the RPC operation. Instead, tcpdump keeps track of “recent” requests, and matches them to the replies using the transaction ID. If a reply does not closely follow the corresponding request, it might not be parsable. AFS Requests and Replies Transarc AFS (Andrew File System) requests and replies are printed as: src.sport > dst.dport: rx packet-type In general, all AFS RPCs are decoded at least by RPC call name. Most AFS RPCs have at least some of the arguments decoded (generally only the `interesting’ arguments, for some definition of interesting). The format is intended to be self-describing, but it will probably not be useful to people who are not familiar with the workings of AFS and RX. If the -v (verbose) flag is given twice, acknowledgement packets and additional header information is printed, such as the RX call ID, call number, sequence number, serial number, and the RX packet flags. If the -v flag is given twice, additional information is printed, such as the RX call ID, serial number, and the RX packet flags. The MTU negotiation information is also printed from RX ack packets. If the -v flag is given three times, the security index and service id are printed. Error codes are printed for abort packets, with the exception of Ubik beacon packets (because abort packets are used to signify a yes vote for the Ubik protocol). Note that AFS requests are very large and many of the arguments won’t be printed unless snaplen is increased. Try using `-s 256′ to watch AFS traffic. AFS reply packets do not explicitly identify the RPC operation. Instead, tcpdump keeps track of “recent” requests, and matches them to the replies using the call number and service ID. KIP AppleTalk (DDP in UDP) AppleTalk DDP packets encapsulated in UDP datagrams are de-encapsulated and dumped as DDP packets (i.e., all the UDP header information is discarded). 1.254 ether AppleTalk addresses are printed in the form 144.1.209.2 > icsd-net.112.220 NBP (name binding protocol) and ATP (AppleTalk transaction protocol) packets have their contents interpreted. NBP packets are formatted like the following examples: ATP packet formatting is demonstrated by the following example: Helios responds with 8 512-byte packets. Jssmag.209 then requests that packets 3 & 5 be retransmitted. Helios resends them then jssmag.209 releases the transaction. IP Fragmentation Fragmented Internet datagrams are printed as Id is the fragment id. Size is the fragment size (in bytes) excluding the IP header. Offset is this fragment’s offset (in bytes) in the original datagram. The fragment information is output for each fragment. The first fragment contains the higher level protocol header and the frag info is printed after the protocol info. A packet with the IP don’t fragment flag is marked with a trailing (DF). Timestamps By default, all output lines are preceded by a timestamp. The timestamp is the current clock time in the form SEE ALSO http://www.iana.org/assignments/media-types/application/vnd.tcpdump.pcap AUTHORS Van Jacobson, Craig Leres and Steven McCanne, all of the Lawrence Berkeley National Laboratory, University of California, Berkeley, CA. It is currently being maintained by tcpdump.org. The current version is available via http: http://www.tcpdump.org/ The original distribution is available via anonymous ftp: ftp://ftp.ee.lbl.gov/old/tcpdump.tar.Z IPv6/IPsec support is added by WIDE/KAME project. This program uses Eric Young’s SSLeay library, under specific configurations. BUGS tcpdump-workers@lists.tcpdump.org NIT doesn’t let you watch your own outbound traffic, BPF will. We recommend that you use the latter. On Linux systems with 2.0[.x] kernels: packets on the loopback device will be seen twice; packet filtering cannot be done in the kernel, so that all packets must be copied from the kernel in order to be filtered in user mode; all of a packet, not just the part that’s within the snapshot length, will be copied from the kernel (the 2.0[.x] packet capture mechanism, if asked to copy only part of a packet to userland, will not report the true length of the packet; this would cause most IP packets to get an error from tcpdump); capturing on some PPP devices won’t work correctly. We recommend that you upgrade to a 2.2 or later kernel. Some attempt should be made to reassemble IP fragments or, at least to compute the right length for the higher level protocol. Name server inverse queries are not dumped correctly: the (empty) question section is printed rather than real query in the answer section. A packet trace that crosses a daylight savings time change will give skewed time stamps (the time change is ignored). Filter expressions on fields other than those in Token Ring headers will not correctly handle source-routed Token Ring packets. Filter expressions on fields other than those in 802.11 headers will not correctly handle 802.11 data packets with both To DS and From DS set. ip6 proto should chase header chain, but at this moment it does not. ip6 protochain is supplied for this behavior. Arithmetic expression against transport layer headers, like tcp[0], does not work against IPv6 packets. It only looks at IPv4 packets.
12 July 2012 TCPDUMP(8) |


コメント
コメント一覧 (3件)
[…] 100%レンタルサーバーを使いこなすサイト tcpdumpのインストールと使い方 パケット解析をするhttps://go-journey.club/archives/1472今回はネットワーク周りで思うようにサーバーが動作し […]
[…] 100%レンタルサーバーを使いこなすサイト tcpdumpのインストールと使い方 パケット解析をするhttps://go-journey.club/archives/1472今回はネットワーク周りで思うようにサーバーが動作し […]
[…] 100%レンタルサーバーを使いこなすサイト 1 pockettcpdump のインストールと使い方 パケット解析をするhttps://go-journey.club/archives/1472今回はネットワーク周りで思うようにサーバ […]